You are using an out of date browser. It may not display this or other websites correctly.
You should upgrade or use an alternative browser.
You should upgrade or use an alternative browser.
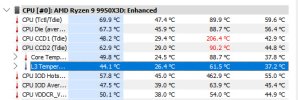
HWiNFO64 CPU Die (Average) Spike?
- Thread starter Venoxium
- Start date
Nothing to worry about... its just false CPU reporting. These are not actual high temps. The CPU will shut down by itself long before it reached 120+C. They have safeties you know...Well, I guess if there aren't any other ways to troubleshoot the problem I'll have to try one of these days running it without Adrenalin. It's just worrying that the temps peak up like that
In your adrenalin drivers, do you have AMD metrics on?
If yes try to disabled them all before you uninstall them.

EDIT:
typo
Last edited:
Well, mate, it looks like the stock cooler can't cool your 5600.The CPU Die 157 degrees Celsius ??
View attachment 11603
is this bug or another reason? i use stock cooler and never saw CPU die beyond 101 degree Celsius.
Jokes aside, that's a reading bug.
Blue Panadol
Member
Hello Martin, I don't use any additional software like you mentioned yet I am also observing these small peaks, I'm using the lates HWINFO version as well.Thanks for your feedback.
This small increase might be different from those double readings discussed mostly in this thread. I can reproduce such smaller peaks when running HWiNFO along with LibreHardwareMonitor, which is also used by some other tools like FanControl. If you experience such issues, try to run HWiNFO without any other such tool.
We need more testing and reports.
Hi Martin, I don't use any additional software and disabled AMD Adrenalin metrics as well. I am seeing spikes with the SoC, MISC, FCLK, UCLK. I am using the latest Gigabyte b650 eagle ax F32e beta bios and the latest beta hwinfo64. I have updated to the latest AMD chipset drivers (AMD 9600x cpu). The voltage spikes aren't double values, MISC would spike from 1v to 1.179v, SoC spikes from 1.194v to 1.277v.
Blue Panadol
Member
Same exact case as me, except i'm using F4 for my Eagle AX, it's definitely not a bios issue, it has to be a sensor issue? since there are other persons with this ~6% increase I believe this isn't something to be too concerned with.Hi Martin, I don't use any additional software and disabled AMD Adrenalin metrics as well. I am seeing spikes with the SoC, MISC, FCLK, UCLK. I am using the latest Gigabyte b650 eagle ax F32e beta bios and the latest beta hwinfo64. I have updated to the latest AMD chipset drivers (AMD 9600x cpu). The voltage spikes aren't double values, MISC would spike from 1v to 1.179v, SoC spikes from 1.194v to 1.277v.
I have no idea if it is a sensor readout bug or not. I have logged the hwinfo64 data to a csv file, and while viewing the data, I noticed that all the spikes happen at the exact same time (I used the logvisualizer web app to view the logs).Same exact case as me, except i'm using F4 for my Eagle AX, it's definitely not a bios issue, it has to be a sensor issue? since there are other persons with this ~6% increase I believe this isn't something to be too concerned with.
Marcus_john
New Member
I have tried several workarounds over the time but none seems to have solved this. When the internal CPU telemetry delivers wrong data, it's hard to "fix" this on my side.
Another issue might be if you're running another monitoring/tweaking or fan/RGB control application that might be colliding with HWiNFO and resulting in wrong data.
Another issue might be if you're running another monitoring/tweaking or fan/RGB control application that might be colliding with HWiNFO and resulting in wrong data.
Marcus_john
New Member
I tried with HWmonitor and it gave me the same high numbers. With zero other programs on and not at the same time as HWinfo.I have tried several workarounds over the time but none seems to have solved this. When the internal CPU telemetry delivers wrong data, it's hard to "fix" this on my side.
Another issue might be if you're running another monitoring/tweaking or fan/RGB control application that might be colliding with HWiNFO and resulting in wrong data.
Similar threads
- Replies
- 2
- Views
- 1K
- Replies
- 12
- Views
- 6K
- Replies
- 1
- Views
- 676


