HWiNFO64 CPU Die (Average) Spike?

The Debug File might show me some more details in this case but it's unable to tell what other software might be causing this.
AMD Adrenalin is not using LHM but several other software (e.g. FanControl) are using it.
Could you please tell me how to determine if the software uses LHW? I'll check the running software or services to find out.
 
Hi, I also keep getting strange values like this. I'm wondering if they're real or if it's a hiccup on HWInfo's part? I'm a little worried about the hardware.

Oddly, the RAM clock rates are also displayed at an increased level, as are values like FCLK uclock and various voltages.

I've also noticed that these strange spikes occur much more frequently and are also worse with the 9950X3D than with the previous 7950X3D.

System is a
Asus ProArt X870E 1303
R9 9950X3D
96GB Corsair 2x48GB 6400CL32@6000CL30
Arctic Cooling Freezer 3 420AIO
HW Info 8.24
 

Attachments

  • 1746296413703.png
    1746296413703.png
    16.1 KB · Views: 13
  • 1746296438860.png
    1746296438860.png
    45.9 KB · Views: 15
  • 1746296499663.png
    1746296499663.png
    90.3 KB · Views: 15
those readings are really not normal!
cpu_vddcr 2.045?
cpu_vddcr_soc 1.747?
if the readings are correct, that processor won't last long.
 
Iam sure its a hikkup, many values are normal, but when the hikkup come, its 50% more or 100% more. Its very good to see with the ram. 3000 4500 and in rare times 6000. I know when the SOC voltage go over 1,4v or 1.5v its a instantkill. like from the OC video from roman/der8auer on the 7xxx
 
I'll add to the chorus. I'm seeing weird spikes in some voltages and temperatures, but everything is running properly and temps are great. I'm using an Asus X870e Apex with the latest BIOS.

The only other software I am using is FanControl, which is taking some HWInfo64 values as input. I'm not doing any overclocking or such, just got the MB somewhat recently and set most things as default during my testing.
 

Attachments

  • Screenshot 2025-06-10 112502.png
    Screenshot 2025-06-10 112502.png
    55.1 KB · Views: 7
  • Screenshot 2025-06-10 112531.png
    Screenshot 2025-06-10 112531.png
    106.4 KB · Views: 8
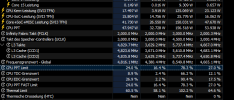
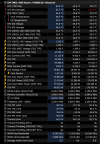
Two days ago it happened to me again, I was using ryzen master, on one monitor ryzen master stayed on, on the other there was some you tube video I was watching, suddenly ryzen master went crazy, nailed almost all values at max to red, and hwinfo reported cpu iod hotspot of 400c.Just checked other parameters carefully, all were fine, voltage parameters were normal, everything except CPU IOD HOTSPOT was ok.
Again, I am bitten by the worm of doubt whether it is a telemetry error, or whether the processor really sticks to this Asrock board when it is idle.
 
Back
Top