Enabling iGPU increases CPU#0 profiling time by a ton

Profetorum

New Member
Was playing games and noticed small but periodic bumps in frametime, so went to hwinfo and noticed that, whenever the igpu is enabled, the GPU#0 profiling time is ~21-24ms . Whenever i disable the igpu, it goes back to ~1-3ms. What's weird is that individual sensors all report 0-1 ms. Tried updating/reverting intels igpu drivers but to no avail (old drivers actually were worse, check second debug file). Also tried messing with safety options but can't really find the culprit. Any clue?

Note that i don't actually game on the igpu, but i wanted to keep it enabled for the qsv encoder
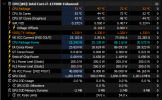
1751709256577.png

as soon as i disable the igpu from device manager:
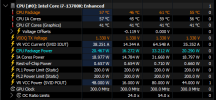
1751710318806.png

added 2 different debug files as 7z archives
 

Attachments

Last edited:
Since the IGPU is integrated into CPU, it's polled as part of the CPU package.
So the additional polling of IGPU via oneAPI/IGCL is causing the additional load.
 
Since the IGPU is integrated into CPU, it's polled as part of the CPU package.
So the additional polling of IGPU via oneAPI/IGCL is causing the additional load.
I noticed even if i disable monitoring for all the sensors except for the main cpu#0 group, the polling time still remains high. So only way would be to disable the igpu entirely ? No options to not monitor the igpu specifically, right?
 
Sorry, there's no option to disable that entirely.
You might try to disable the "opeAPI Support" option in HWiNFO. That will disable most of Intel GPU monitoring functions except a few IGCL calls. Maybe that will help at least partially.
 
Sorry, there's no option to disable that entirely.
You might try to disable the "opeAPI Support" option in HWiNFO. That will disable most of Intel GPU monitoring functions except a few IGCL calls. Maybe that will help at least partially.
Tried already but sadly no changes. Well, thank you for the quick response :)
 
Back
Top