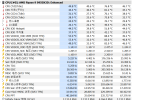
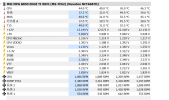
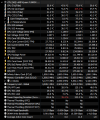
A few days ago, I assembled a 9950X3D with an MSI B850 EDGE TI WIFI. Over the past two days, while debugging and using the system, I noticed that the VDDCR_SOC voltage recorded in Hwinfo exceeded the set value significantly twice. The screenshot below was taken today, showing that the SVI3 TFN voltage is much higher, while the motherboard sensor readings appear normal. In the screenshot, the maximum recorded values for VDDCR_VDD, VDDCR_SOC, and VDDCR_MISC are roughly twice the real-time displayed values. At the time of this screenshot, the system was running RunMemtest, and there were no other abnormalities in the system, nor did the RunMemtest report any errors.
Prior to this, yesterday, the VDDCR_SOC voltage was once recorded at a high of 1.88V. Hwinfo also displayed several other anomalous values at the time, such as a maximum CPU IOD Hotspot temperature of 465°C. Upon discovering this, I immediately shut down the system but did not have time to take a screenshot. Upon restarting, everything appeared normal. Additionally, yesterday, a pair of Acer 6400C32 memory modules failed to run stably at 6400MHz. Today, I replaced them with a pair of LingShuang 6000C28 modules, which successfully passed stress testing. Before swapping the memory today, I specifically removed the CPU to inspect the contact pins and the motherboard's CPU socket but found no signs of overheating or high temperatures.
The overall system settings during both instances of memory anomalies were as follows:
Initial memory setting: EXPO enabled
First occurrence: SOC voltage manually set to 1.25V
Second occurrence: SOC voltage set to AUTO, displaying 1.205V
CPU settings: PBO 8X, 90°C temperature limit, CCD0 -15, CCD1 -20
Could this be a sensor display error, a BIOS vulnerability in SOC voltage hard-locking, or some other issue?
